The Great Reversal: Why the Rust Belt Is Outperforming the Sun Belt This Spring
Educational overview. Not individualized financial, legal, or tax advice. How we source and check numbers.
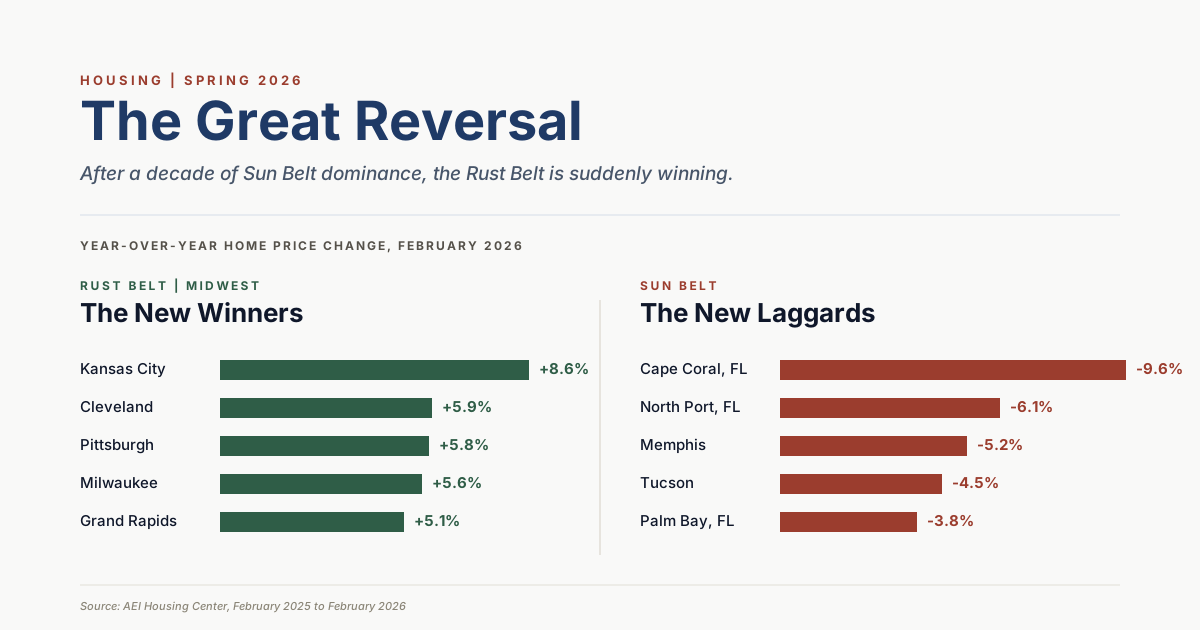
For most of the last decade, the story was simple: if you wanted housing appreciation, you looked to Austin, Tampa, or Phoenix. In spring 2026, that script has flipped. The reversal is one of the clearest signs that the post-pandemic housing era is over and regional fundamentals are mattering again.
Flat nationally, two speeds locally
Several pandemic-era winners are now lagging. Reporting from Zillow Research and coverage in Fortune highlighted sharp year-over-year price pressure in Florida Gulf Coast markets, with Cape Coral among the weaker performers nationally. At the same time, Midwestern metros including Kansas City, Cleveland, and Pittsburgh showed relative strength in multiple spring 2026 dashboards, a pattern AEI Housing Center commentary described as mean reversion after migration-driven overvaluation in Sun Belt markets.
The correction is also forcing a rethink of old affordability assumptions. Even high-cost California metros that were symbols of chronic overvaluation have seen enough reset that some valuation models show them closer to long-run norms, per Cotality (formerly CoreLogic) regional indices cited in industry press.
At the national level, home-price growth has slowed to a near-flat pace. The National Association of Realtors (NAR) spring 2026 commentary described a market with far less pricing power than 2021-2022, but not a broad crash. In practical terms: direction now depends more on local inventory, local job strength, and seller discipline than on national headlines alone.
Inventory is improving off a constrained base. NAR and HousingWire Research both noted rising months-of-supply versus the tightest pandemic years. Demand exists, but many first-time buyers remain payment-constrained at prevailing mortgage rates, so pricing precision matters more than ever.
Homes priced realistically are still moving. Homes priced as if peak-era conditions still apply are sitting longer, requiring cuts, or being withdrawn. This is the practical shape of rebalancing: liquidity for accurate pricing, friction for aspirational pricing. Sellers in overheated 2021-2022 markets feel this first; buyers in rebalancing Midwestern markets see more negotiating room.
Mid-6 percent rates, and who can still transact
Just as affordability began to recover in some metros, rates pushed back up into the mid-6% range. The Freddie Mac Primary Mortgage Market Survey (PMMS) averaged near 6.7% on 30-year fixed loans in spring 2026, keeping payment math sensitive for first-time buyers. Small rate moves look minor in headlines but are meaningful in household budgets. See what affects mortgage rates for why Treasury and MBS markets matter more than any single Fed meeting headline.
One defining feature of this cycle is demographic divergence. Equity-rich older owners can transact with less rate sensitivity, while first-time buyers remain constrained by payment, down payment, and debt profile. NAR buyer profile data and Federal Reserve household balance sheet reports consistently show this split: two different housing markets under one national label. First-time buyers should plan from checklist and DTI reality, not from national median buyer anecdotes.
What to watch after April, and how to use it
A sustained move in mortgage rates closer to 6 percent would likely unlock activity. Sticky mid-6s preserve the standstill. Track Rateshive benchmarks and PMMS weekly. Continuing inventory gains support buyer choice; stalled listings could tighten conditions again. Watch NAR existing-home inventory. Local Case-Shiller and MLS data still matter more than national averages. Compare your metro to the May 2026 follow-up. Tech and remote-work migration still ripple through Sun Belt demand.
Buyers should run payment and offer math with the mortgage calculator, offer comparison, and rent vs buy framework. Sellers should model net proceeds with the seller net sheet and offer comparison guide before accepting the highest headline price. 2026 increasingly looks like a rebalancing year, not a broad crash cycle. Outcomes diverge by metro, life stage, and financing flexibility. Strategy has to be local and realistic on payment sensitivity.
How to read a national average when your metro disagrees
A flat national price index can hide a Gulf Coast listing that needs a cut and a Midwestern listing that still gets two offers. The spring of 2026 looked like that split in the public dashboards: pandemic-era winners giving back ground, and a set of older industrial metros holding up better than the national headline. That is mean reversion after a migration boom, not a single story you can shop with. Your comps, your tax bill, and your rate quote decide the house. The national chart decides the mood of the article you read on Sunday.
Rates near the mid-6s kept first-time buyers payment-constrained while equity-rich owners could still move. Those are two markets under one label. Owners rolling equity and first-time buyers hitting a payment ceiling were not shopping the same houses, even when a national index looked calm. Mixing them into one sentence is how people tour homes they cannot close.
If you are in the first group, the useful work is the payment and the debt-to-income file, not a debate about whether the country is crashing. If you are selling into the second group, price to what closed in the last sixty days. Aspirational list prices were already sitting. The follow-up reads are the May note and the mortgage-spread research.
The useful local check was months of supply and days on market for homes that actually sold, not the national year-over-year price change. A metro can post a small price gain and still be a buyer's market if listings are sitting. The reverse was also true in a few tight neighborhoods. That is why the spring pieces kept sending readers back to comps instead of to the national index. Payment sensitivity did the rest of the work. A small rate move mattered more to a first-time buyer than a one-percent change in the national price index. That is why the useful spring question was local supply and a payment you could carry, not whether the country was "up" or "down" on a year-over-year chart.