More Supply, Sticky Inflation: What May 2026 Means for Buyers and Sellers
Educational overview. Not individualized financial, legal, or tax advice. How we source and check numbers.
Featured · May 2026
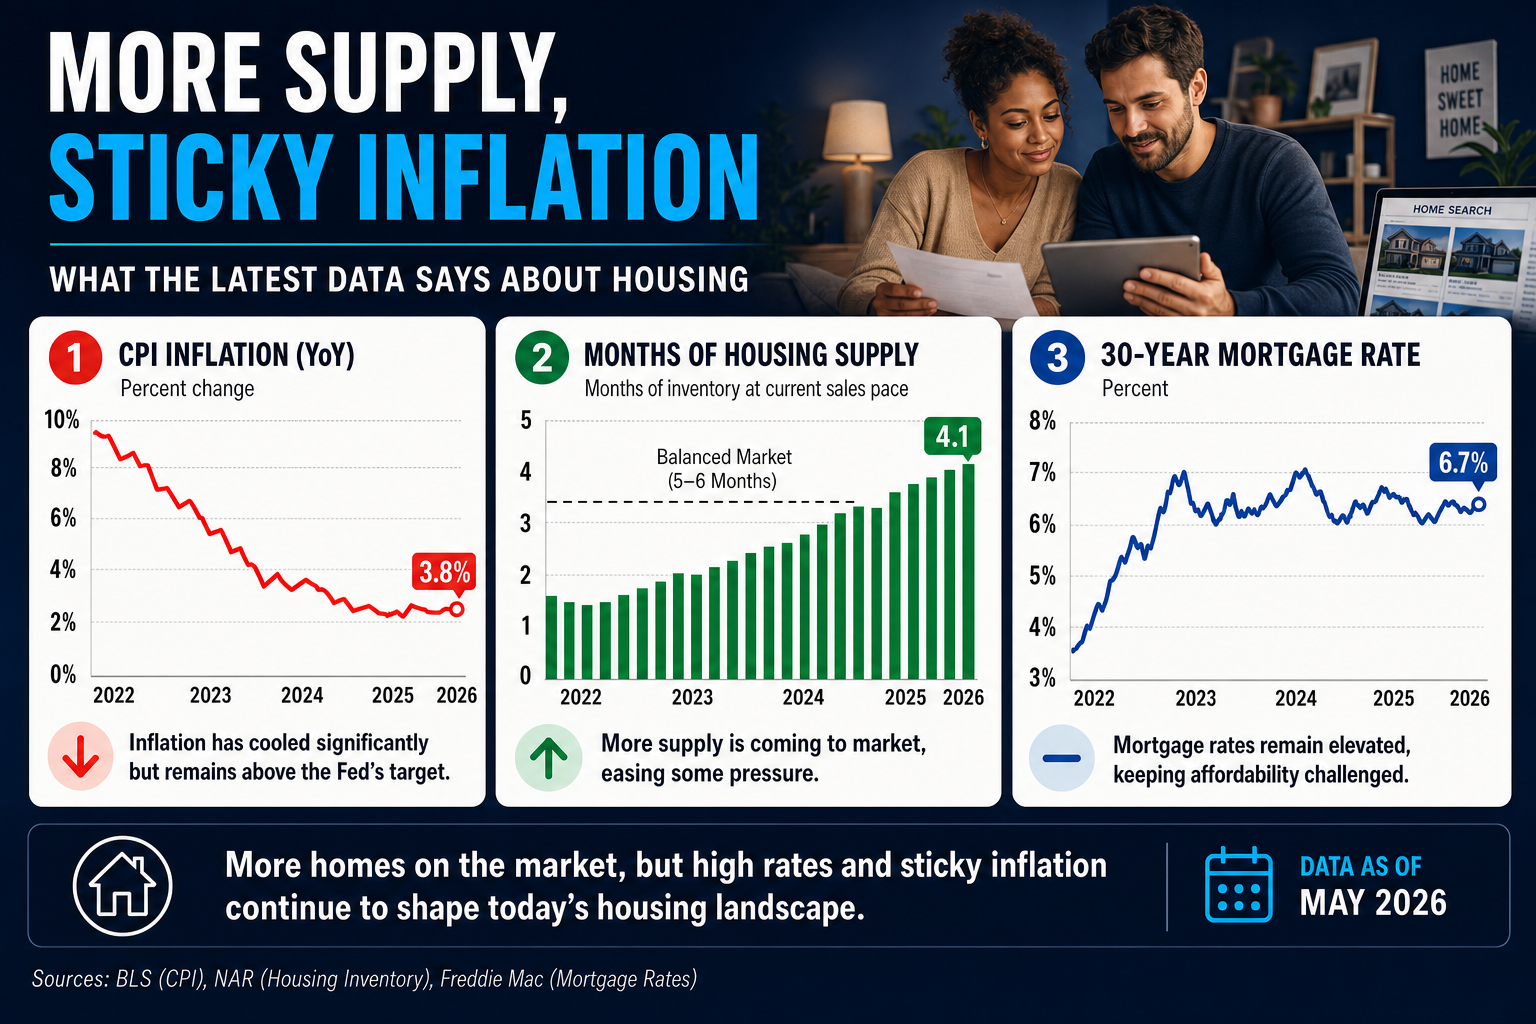
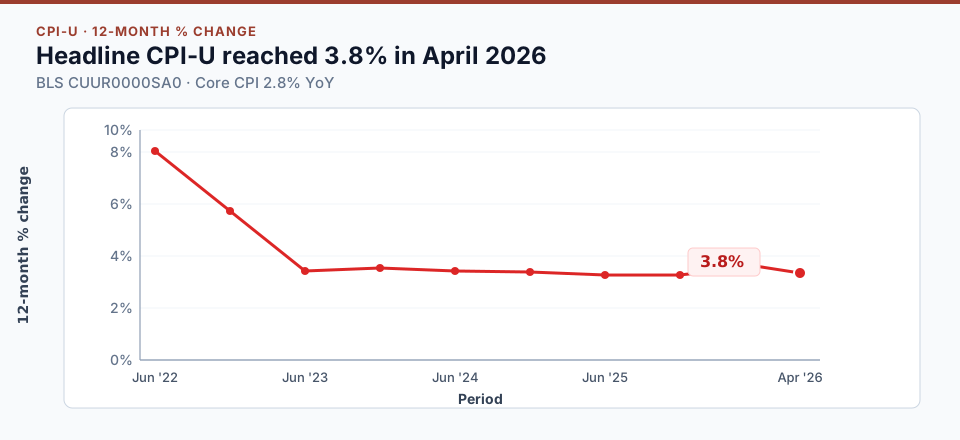
Headline CPI-U reached 3.8% year over year through April 2026, still well above the Fed 2% target. At the same time, more homes are sitting on the market than during the pandemic-era shortage. That mix changes leverage for buyers who finally see choice, and for sellers who can no longer assume multiple offers on day one.
National headlines still talk about the housing market as one thing. On the ground, May 2026 looks more like a negotiation market: prices are not collapsing in most metros, but time-on-market and inventory are telling buyers they can compare, walk away, and ask for concessions again. Sellers who price like it is still 2021 are the ones carrying the adjustment.
Inflation is lower than 2022, but headline CPI picked up again
The Consumer Price Index for all urban consumers (CPI-U) is far below the 8% to 9% year-over-year readings of 2022. The latest print is not a return to that era: for the 12 months ending in April 2026, headline CPI-U rose 3.8%, up from 3.3% in March and from 2.4% in both January and February 2026. On an unadjusted basis, the all-items index increased 0.9% from March to April alone.
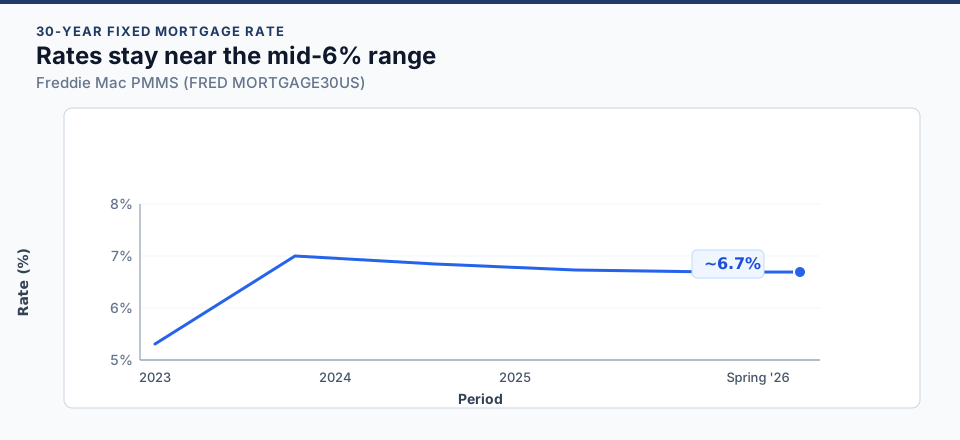
Core inflation (all items less food and energy) increased 2.8% over the same 12-month window, up from 2.6% through March. The Bureau of Labor Statistics noted that energy and food contributed heavily to the headline move, with the energy index up 17.9% year over year and food up 3.2%. Even so, the headline rate is again well above the Federal Reserve 2% objective, which keeps bond markets cautious and helps explain why mortgage rates have stayed near 6.7% on average rather than drifting back toward the sub-4% era.
Rising inventory is the biggest shift on the ground
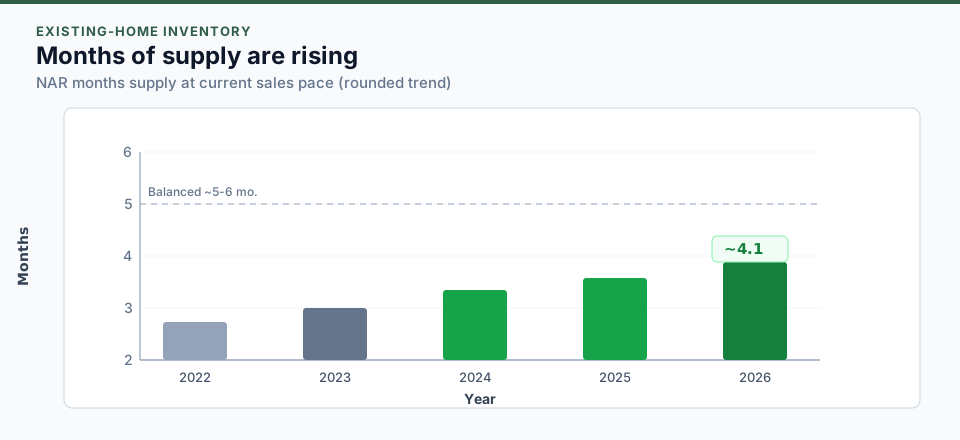
Months supply measures how long it would take to sell current listings at the current sales pace. When that number climbs toward four months, and in some markets higher, buyers gain something they lacked for years: time. Time to inspect thoroughly, compare neighborhoods, and negotiate without fearing another bidder will appear in an hour.
For sellers, rising inventory is not a crash signal by itself. It is a pricing signal. Homes that are clean, well marketed, and priced to recent comps still move. Homes priced for peak-era appreciation sit, accumulate price cuts, and train buyers to wait for the next reduction.
Mortgage rates remain the affordability gate
Even a modest change in the 30-year fixed rate moves hundreds of dollars per month on a typical loan size. After the rapid rate shock of 2022 and 2023, many households are still anchored to older payment expectations. That gap explains why demand can look healthy in surveys but cautious in contract data.
Rates can fall on good inflation prints and rise on hot labor or growth surprises. For May 2026, the practical takeaway is to separate where rates are from where you need them to be. Strategy should assume ~6.7% math unless your timeline can absorb volatility.
What the month asked of buyers and sellers
Buyers had leverage again and needed to use it deliberately: credits, inspections, and a close date someone could actually meet, instead of waiving everything to compete with ghosts. A deal on list price can still fail the month if taxes, insurance, or HOA run high. Model PITI and escrow and debt-to-income before a floor plan becomes the budget. Rent versus buy is still local. In some markets, renting plus investing the difference still wins on a five-year horizon. Compare with the rent vs buy calculator using your actual rent.
Sellers needed today's comps, not last spring's neighbor. Buyers were comparing listings that sat an extra two weeks. Net proceeds still beat list price: commission, payoff, concessions, and closing costs decide what you keep. Estimate with the seller net sheet, rank offers on certainty in the offer comparison tool, and check seller closing costs by state before you plan the next purchase.
May 2026 is not a repeat of 2008, and it is not 2021 either. It is a market where math, patience, and realistic pricing matter more than national mood headlines.
Ongoing inflation kept rate relief uneven. Rising inventory gave buyers room to negotiate and sellers a sharper incentive to price accurately. Neither trend by itself told you what to do. Together they argued for local data, payment discipline, and tools that translate headlines into numbers.
For a daily macro snapshot with live series, see Rateshive Insights. For calculators and workspaces, visit all tools.
How to use a May note after the month has turned
This piece stays dated on purpose. The April inflation print and the May inventory story were the facts that month. They are not this week's quote. What still travels is the method: a national mood was a poor shopping list, and the payment that included tax and insurance was the budget. If you are reading this later in the year, start with the October market note for the current season, then come back here to see what we said when rising supply was the new fact and rates were still the gate.
The series behind the charts have not changed their definitions. Freddie Mac's weekly survey is still MORTGAGE30US on FRED. The consumer price index is still the Bureau of Labor Statistics release linked below. A later month can print a different level without making the May comparison useless. It shows whether the story moved, or whether only the headline did.