Summer 2026 Housing: Negotiation Season With Rates Still Near 6.7%
Educational overview. Not individualized financial, legal, or tax advice. How we source and check numbers.
Featured · June 2026
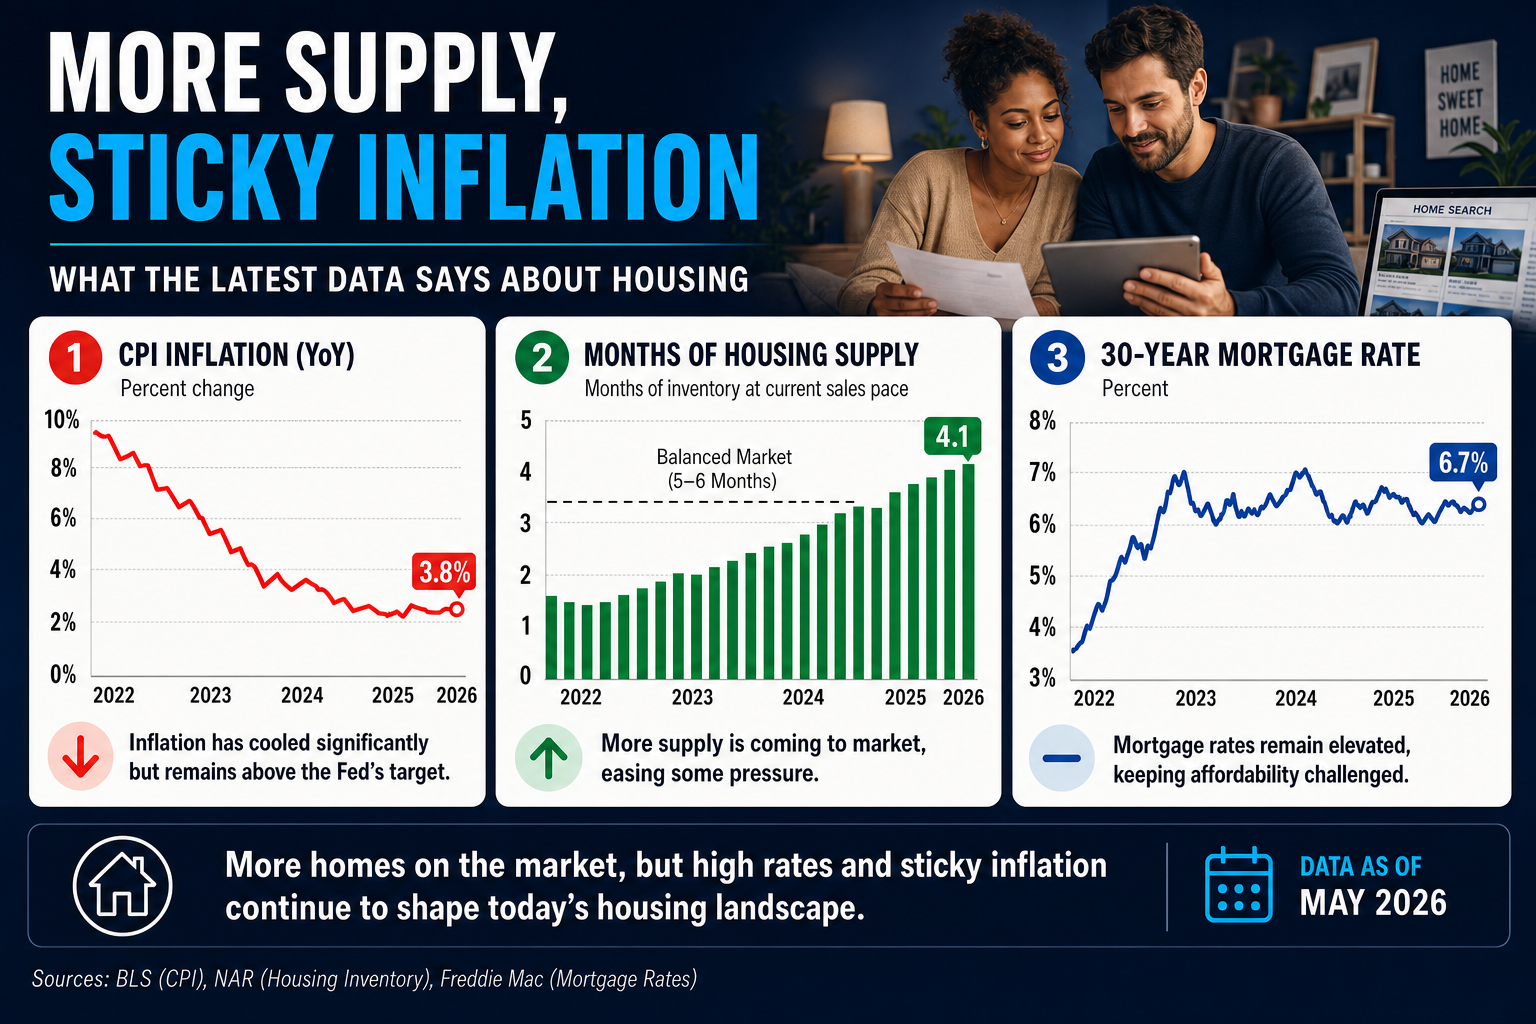
June opens with the same macro tension May left behind: headline inflation still above the Federal Reserve 2% target, inventory high enough for buyers to compare again, and 30-year mortgage rates still averaging near 6.7%. The summer season adds volume and emotion, but the math still rules who can buy, who can sell cleanly, and who should wait.
National narratives still flatten the market into one mood. On the ground, June 2026 looks like a negotiation season: more tours, more price adjustments on stale listings, and more buyers willing to walk when payment math fails. Sellers who anchor to 2021-era urgency are doing more repricing than sellers who underwrite their ask against current comps and carrying costs.
Inflation cooled from 2022 peaks but is not finished with housing
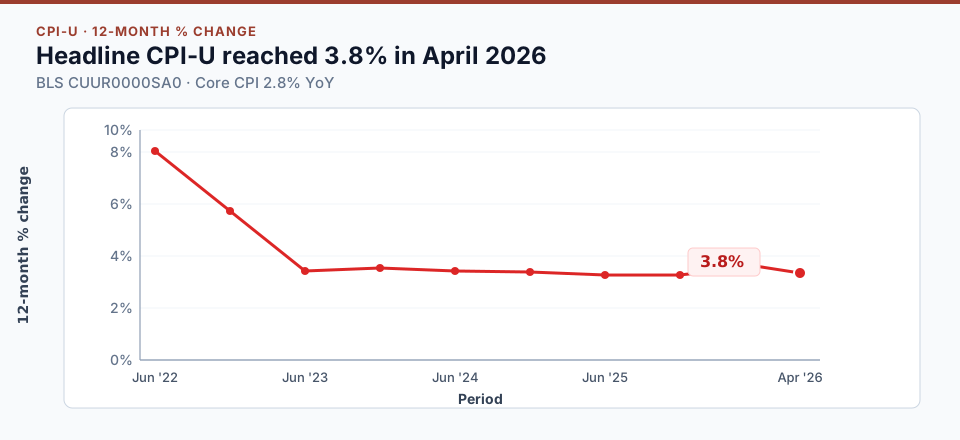
For the 12 months ending in April 2026, headline CPI-U rose 3.8%, up from 3.3% in March. Core CPI increased 2.8% over the same window. Energy and food still move the headline number, but the takeaway for borrowers is familiar: long-term rates stay sensitive because inflation is again running well above the Fed 2% objective.
That does not mean a return to 2022 shock levels. It means relief on mortgage rates is likely to be uneven, tied to data surprises and bond market repricing, not a straight line down.
Inventory is the summer story for buyers
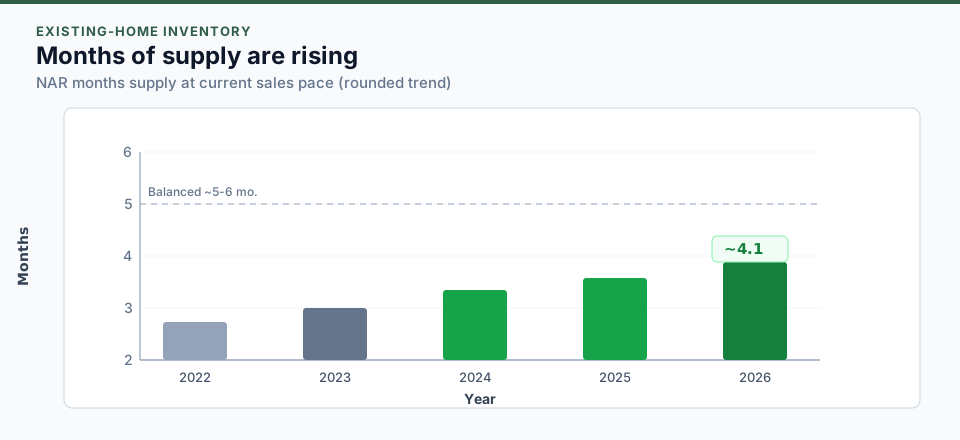
Months supply near 4.1 is not a crash metric. It is a choice metric. Buyers can compare condition, location, and seller motivation without the panic bidding that defined 2021 and 2022. Inspection contingencies, credits, and realistic close timelines are back on the table in many metros.
For sellers, higher inventory is a marketing problem when the price is wrong. Well-prepared homes that match recent sales still move. Overpriced homes train the market to ignore your listing until a cut makes news in the neighborhood.
Rates near 6.7% still filter who can stretch
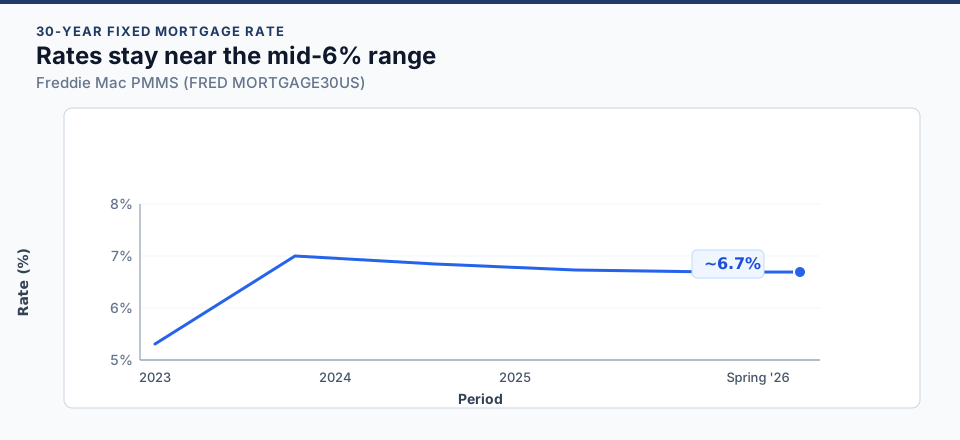
Freddie Mac PMMS has averaged near 6.7% on the 30-year fixed in recent weeks. On a typical loan size, each 0.25% rate move still shifts monthly payment by meaningful dollars. June seasonal demand does not override that arithmetic.
Fed communications remain a background driver, but long-term mortgage rates follow the bond path, not every headline about the policy rate. See why rates move when the Fed holds steady and what actually affects mortgage rates for the full stack.
What June asked of people still trying to transact
Buyers who did well in June pre-approved on the full housing number, not principal and interest alone. See PITI and escrow. They compared Loan Estimates on cash to close, not billboard rates (APR and points), asked for credits where comps supported it, and ran DTI before raising an offer to beat a summer weekend. Walking away was viable again in many markets.
Sellers who did well priced to May-June comps, not last spring's neighbor. Stale days on market is a signal buyers read instantly. They modeled net, not list, in the seller net sheet and offer comparison tools, ranked certainty over a fragile high price, and checked seller closing costs by state before they listed.
June 2026 rewards preparation: buyers who know their payment ceiling, sellers who know their net proceeds, and both sides who use local data instead of national mood headlines.
Summer volume will rise, but the macro backdrop has not handed either side a free win. Inflation keeps rate relief choppy. Inventory keeps buyers choosy. Tools and daily snapshots exist to translate that into numbers you can act on.
For automated daily context, see Rateshive Insights (including our weekly editor’s note). For calculators and workspaces, visit all tools.
What the summer numbers did not settle
A cooler inflation print and a slightly friendlier rate week do not hand either side a free win. Buyers who did well in June already knew the full housing payment, including tax, insurance, and mortgage insurance, and they compared Loan Estimates on cash to close rather than on a billboard rate. Sellers who did well priced to recent closed sales, not to a neighbor's list price from the prior spring. Days on market was already a signal buyers could read. A higher offer with weak financing was often more expensive than a cleaner lower one once you counted the cost of coming back to market in July.
Summer volume rising does not mean the payment math got easier. Inventory gave buyers room to ask. Rates near the high 6s still decided who could stretch. Those two facts can be true in the same week, which is why a national mood headline was a poor shopping list.
The charts above are education, built from public series, and they describe a national backdrop. Your metro can be tighter or looser than that backdrop in the same month. Use them to set expectations, then use local comps and a payment you have stress-tested. The evergreen mechanics have not changed with the season: PITI and escrow, whether to lock, and why the mortgage spread moves on its own.
Read June as a snapshot, not as a standing instruction. The later seasonal read is the October 2026 market note. If you are locking now, the survey level on FRED's MORTGAGE30US is the thermometer, and the Loan Estimate is the price. A friendlier week inside June did not retire the spread, the tax bill, or the insurance quote. Those three still decide whether a summer payment is one you can keep in the fall.